

Image Details
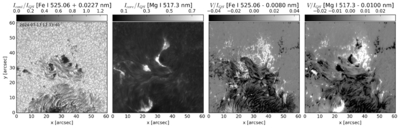
Caption: Figure 5.
Example TuMag observations obtained on 13 July 2024 during an M5.3-class flare in NOAA AR 13738, showing a frame close to the flare peak. The panels display, from left to right (1) the continuum intensity at +22.7 pm (+227 mÅ) from the Fe I 525.06 nm line, (2) the Mg I 517.26 nm line-core intensity, (3) Stokes V in the Fe I 525.06 nm line wing at −8 pm (−80 mÅ), and (4) Stokes V in the Mg I 517.26 nm line wing at −10 pm (−100 mÅ). All panels are normalized to the average quiet-Sun continuum intensity, IQS. The data have been reconstructed using wave front and PD techniques. Residual instrumental effects may still be present at this stage of the data reduction.
Other Images in This Article

Copyright and Terms & Conditions
© 2026. The Author(s). Published by the American Astronomical Society.

