Image Details
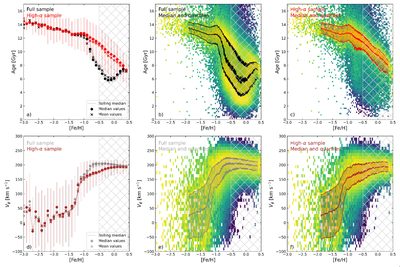
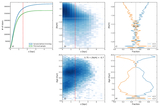
Caption: Figure 5.
(a) Age–[Fe/H] relation. Comparison of the rolling median trend using 1000 data points and used in this Letter with median and mean values calculated in bins of size 0.1 dex. Symbols as given in the legend. The error bars represent the one σ around the mean values. For clarity, we only show the error bars for the high-α sample. (b) Age–[Fe/H] relation for the full sample as well as a 2D histogram of the whole dataset. We also show the upper and lower quartiles. (c) Age–[Fe/H] relation for the high-α sample as well a 2D histogram of the data. We also show the upper and lower quartiles. (d) Vϕ–[Fe/H] relation. Comparison of the rolling median trend using 1000 data points and used in this Letter with median and mean values calculated in bins of size 0.1 dex. Symbols as given in the legend. The error bars represent the one σ around the mean values. For clarity, we only show the error bars for the high-α sample. (e) Vϕ–[Fe/H] relation for the full sample as well as a 2D histogram of the whole dataset. We also show the upper and lower quartiles. (f) Vϕ–[Fe/H] relation for the high-α sample as well a 2D histogram of the data. We also show the upper and lower quartiles. In all panels, the hatched area shows the data we do not take into account in our analysis, as the separation of the high- and low-α stars is less certain above –0.5 dex.
Other Images in This Article
Copyright and Terms & Conditions
© 2026. The Author(s). Published by the American Astronomical Society.