Image Details
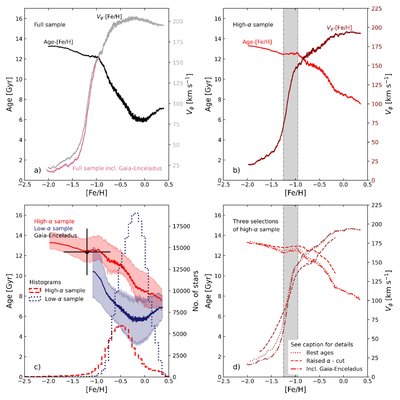
Caption: Figure 2.
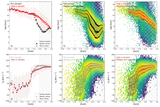
Determination of the age of the spin-up. The trends are calculated by rolling over a bin including 1000 data points along the [Fe/H] axis. (a) Full sample. The age–[Fe/H] relation is shown in black, and the Vϕ–[Fe/H] relation is shown in gray. (b) High-α sample. The age–[Fe/H] relation is shown in red, and the Vϕ–[Fe/H] relation is shown in brown. The gray shaded area shows the identified [Fe/H] range of the spin-up. (c) Comparison of the age–[Fe/H] relations for the high- and low-α samples in red and blue, respectively. The red and blue shaded areas show the interquartile ranges for each sample. The median position of the kinematically selected Gaia-Enceladus stars in [Fe/H] and age are shown as a black filled circle with error bars indicating the 1σ standard deviation. The metallicity distributions for the high- and low-α samples are shown as histograms in red and blue, respectively. (d) Same as panel (b), but applying more restricted selection criteria. “Best age” means an error in age of less than 10%; “raised α - cut” indicates a sample where the cut for the high-α sample has been raised by 0.08 dex. This means that the sample stops just below solar metallicity. In this panel, all three curves are calculated rolling over a bin of 1000 data points, but here, the curves have also been smoothed to ease the comparison. Line styles as indicated in the legend.
Other Images in This Article
Copyright and Terms & Conditions
© 2026. The Author(s). Published by the American Astronomical Society.