Image Details
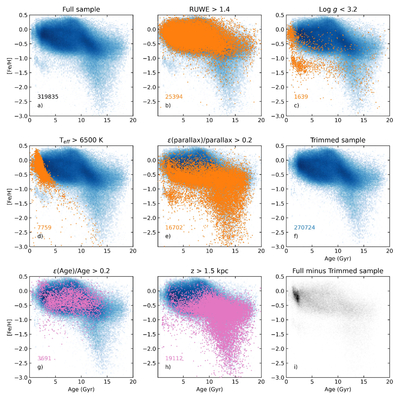
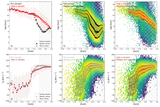
Caption: Figure 3.
Age–metallicity plots exploring the properties of the stars in M. Xiang et al. (2025). (a) Full sample. (b) Shows where the stars with ruwe> 1.4 fall in orange. (c) Shows the stars with ﹩{\mathrm{log}}\,g\lt 3.2﹩ in orange. (d) Shows the stars with relative error in parallax > 0.2 in orange. (e) Shows the sample when it has been trimmed using ruwe, parallax, Teff, and ﹩{\mathrm{log}}\,g﹩. (f) Shows the trimmed sample. (g) Shows the trimmed sample with stars with a relative error in age > 0.2 in pink. (h) Shows the trimmed sample with the stars with |z|> 1.5 kpc in pink. (i) 2D histogram of the full minus the trimmed sample. In this panel, the 2D histogram the maximum value in the gray scale is set to 58.
Other Images in This Article
Copyright and Terms & Conditions
© 2026. The Author(s). Published by the American Astronomical Society.