Image Details
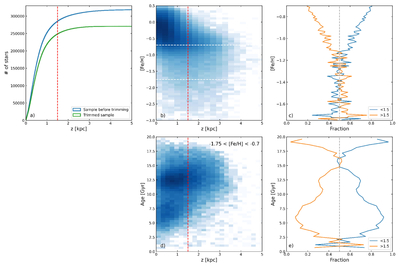
Caption: Figure 4.
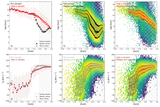
(a) Cumulative histograms of the stars in the full sample and the trimmed sample (see Section 2 and Appendix A.1) as a function of height above the Galactic plane (z). The cut at z = 1.5 kpc is marked with a red dashed line. (b) 2D histogram of [Fe/H] as a function of z for the trimmed sample, where the blue color shows the number of stars. The cut at z = 1.5 kpc is marked with a red dashed line. The white horizontal dashed lines mark the [Fe/H]–range over which the Milky Way shows the spin-up; compare Figures 1 and 2. (c) The fraction of stars above and below z = 1.5 kpc as a function [Fe/H] for the stars with −1.75 < [Fe/H]< − 0.7. (d) 2D histogram of age as a function of z for the stars with −1.75 < [Fe/H]< − 0.7. The blue color shows the number of stars. The cut at z = 1.5 kpc is marked with a red dashed line. (e) The fraction of stars above and below z = 1.5 kpc as a function age for the stars with −1.75 < [Fe/H]< − 0.7.
Other Images in This Article
Copyright and Terms & Conditions
© 2026. The Author(s). Published by the American Astronomical Society.