Image Details
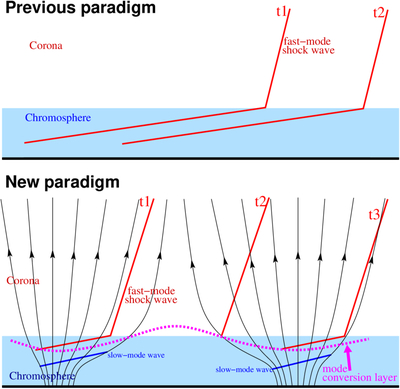
Caption: Figure 4.
Schematic sketch comparing the traditional understanding of Moreton wave and our new paradigm. The top panel is the old paradigm presented in P. F. Chen (2016), while the bottom panel is the new paradigm considering the strong inhomogeneity of the magnetic field in the lower solar atmosphere. The thin black lines represent the magnetic canopy-like structure. The red lines indicate the fast-mode MHD wave front, whereas the blue lines correspond to slow-mode wave fronts in the chromosphere.
Other Images in This Article
Copyright and Terms & Conditions
© 2026. The Author(s). Published by the American Astronomical Society.
Copyright ©
2026 Astronomy Image Explorer. All Rights Reserved.