Image Details
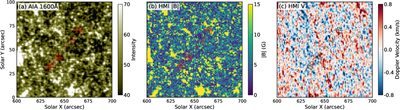
Caption: Figure 2.
Spatial relationship between the Moreton wave front at 12:55:47 UT and different proxies of photospheric networks, i.e., the AIA 1600 Å intensity image (panel (a)), the HMI longitudinal magnetic intensity (panel (b)), and the HMI Dopplergram. The Moreton wave front is indicated by the red dots in panels (a) and (b) and black dots in panel (c).
Other Images in This Article
Copyright and Terms & Conditions
© 2026. The Author(s). Published by the American Astronomical Society.
Copyright ©
2026 Astronomy Image Explorer. All Rights Reserved.