Image Details
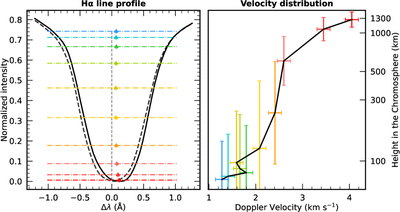
Caption: Figure 3.
Left panel: normalized Hα spectral profile of the Moreton wave front at 12:55:47 UT (solid black line) and the spectral profile of the reference quiet region (dashed black line), where the vertical dashed gray line indicates the line center in the rest frame of reference. The colored horizontal lines (from bottom to top) mark the wavelength windows from ±0.1 to ±1.0 Å. The colored dots indicate the bisector offset of each wavelength window (corresponding to certain heights in the chromosphere). Right panel: derived Doppler velocity of the Moreton wave as a function of chromospheric height based on the bisector method.
Other Images in This Article
Copyright and Terms & Conditions
© 2026. The Author(s). Published by the American Astronomical Society.