Image Details
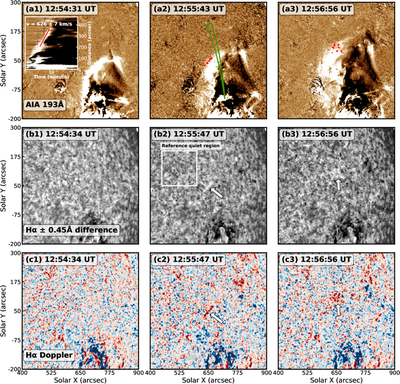
Caption: Figure 1.
Evolution of the coronal EUV wave and the associated Hα Moreton wave. Panels (a1)–(a3) show time sequences of the base-difference images in AIA 193 Å, illustrating the propagation of the coronal EUV wave. The base image is at 12:51:03 UT. The time–distance diagram in panel (a1) is constructed along the sector marked by the green line in panel (a2). The red markers in panels (a2)–(a3) indicate the locations of the contemporaneous Moreton wave fronts. Panels (b1)–(b3) display the difference Hα images constructed from the blue-wing minus red-wing intensity, highlighting the chromospheric signatures of the Moreton wave as indicated by the arrows. Panels (c1)–(c3) show the corresponding Hα Dopplergrams, where the redshifted features indicated by the arrows mark the propagation of the Moreton wave fronts. The animation of the AIA 193 Å sequence is available online. The animation starts at 12:48:18 UT and ends at 13:07:54 UT. A fast-mode coronal EUV wave is seen to propagate northward. The cospatial Moreton wave is highlighted in red in the animation at the same times as shown in panels (a2) and (a3). The real-time duration of the animation is 7 s.
(An animation of this figure is available in the online article.)
(An animation of this figure is available.)
The video/animation of this figure is available in the online journal.
Other Images in This Article
Copyright and Terms & Conditions
© 2026. The Author(s). Published by the American Astronomical Society.