Image Details
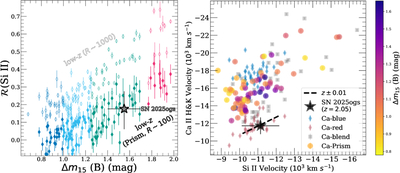
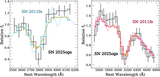
Caption: Figure 7.
Left: comparison of ﹩{ \mathcal R }﹩(Si II) (the ratio of the absorption depth of Si II λ5972 to Si II λ6355; P. Nugent et al. 1995) of SN 2025ogs (black star) to the low-z sample (colored points) vs. Δm15(B). The color of each point references the corresponding composite spectrum (from Figure 6) to which these SNe contribute. The open points correspond to measurements derived from the individual spectra at their original resolution. The closed points result from convolving these individual spectra with the NIRSpec prism dispersion function and remeasuring ﹩{ \mathcal R }﹩(Si II). Right: comparison of the Si II and Ca II H and K ejecta velocities of SN 2025ogs (black star) to the low-z sample (colored points) using the techniques illustrated in Figure 8. Light-colored diamonds correspond to measurements from the low-z sample using spectra at their original resolution. The red points result from the photospheric component of Ca II H and K, while the blue points are from the HV component. The gray squares (“Ca-blend”) represent velocities measured from the minimum of the Ca II H and K feature when two separate components are not clearly visible. The colored circles (color indicating the value of Δm15(B)) result from measuring the minimum of Ca II H and K after convolving the low-z spectra with the NIRSpec prism dispersion function. The black dashed line indicates how the conservative uncertainty on redshift (z ± 0.01) would impact the ejecta velocity measurements of SN 2025ogs. While the Si II velocity is consistent with the low-z sample, the Ca II H and K velocity is significantly lower.
Other Images in This Article
Copyright and Terms & Conditions
© 2026. The Author(s). Published by the American Astronomical Society.