Image Details
Caption: Figure 2.
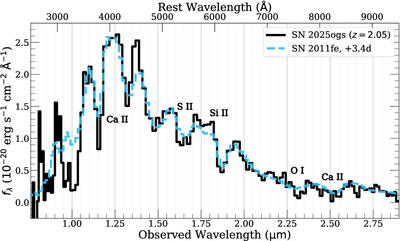
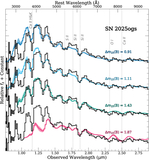
Comparison of our NIRSpec prism spectrum of SN 2025ogs (black) to SN 2011fe (blue) at 3.4 days after peak brightness. The spectrum of SN 2011fe has been convolved with the prism dispersion function, rebinned, and scaled to match the observation.
(The data used to create this figure are available in the online article.)
(The data used to create this figure are available.)
Other Images in This Article
Copyright and Terms & Conditions
© 2026. The Author(s). Published by the American Astronomical Society.
Copyright ©
2026 Astronomy Image Explorer. All Rights Reserved.