Image Details
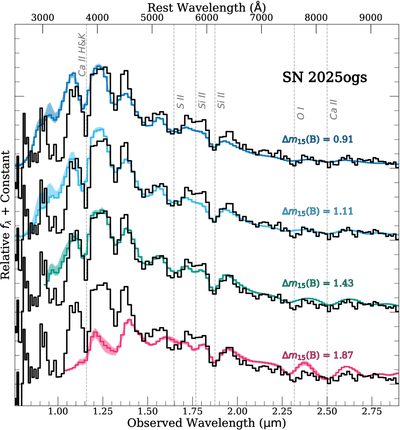
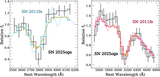
Caption: Figure 6.
Comparison of SN 2025ogs (black) to maximum-brightness (−3 < t < 3 days) composite spectra generated with kaepora (M. R. Siebert et al. 2019) for a variety of light-curve shapes (colored curves). The shaded regions are the 1σ uncertainties estimated via bootstrap resampling. The mean Δm15(B) of the composite spectra ranges from 0.91 to 1.87. Overall the continuum and features are most similar to the Δm15(B) = 1.43 composite spectrum (consistent with the light curve). The largest differences appear to be in the NUV (<3500 Å) and in the velocity of some spectral features (notably Ca II H and K, O I λ7774, and the Ca II NIR triplet).
Other Images in This Article
Copyright and Terms & Conditions
© 2026. The Author(s). Published by the American Astronomical Society.