Image Details
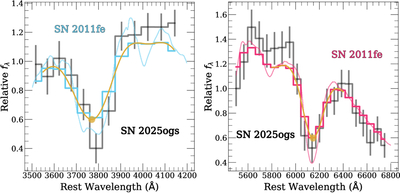
Caption: Figure 8.
Left: example measurement of the JWST prism-convolved Ca II H and K ejecta velocity that can be inferred from NIRSpec prism spectra at this redshift. The thin-blue colored curve is SN 2011fe at peak brightness in its original resolution. The thick blue colored curve is the same spectrum, but convolved with the NIRSpec prism dispersion function. We measure the velocity from the minimum of the yellow curve (smoothed and interpolated from the thick blue curve). At this resolution, the low-velocity photospheric component and HV component cannot be independently measured. We show SN 2025ogs (black curve) for comparison, where the minimum of Ca II H and K is less blueshifted. Right: same as the left panel, but for Si II. Here, there is only one velocity component contributing to the measurement.
Other Images in This Article
Copyright and Terms & Conditions
© 2026. The Author(s). Published by the American Astronomical Society.