Image Details
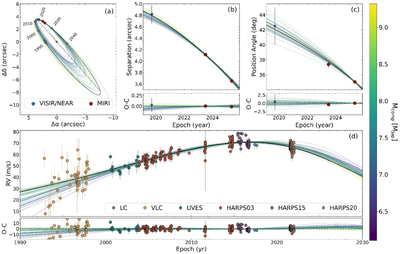
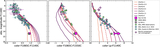
Caption: Figure 7.
Best-fit orbit solutions. Here, we show the on-sky orbit traced by Eps Ind Ab in panel (a); the evolution of the on-sky separation and position angle of the planet during our observational baseline in panels (b) and (c), respectively; and the RV data in panel (d). The maximum a posteriori solution is shown with a thick black line, alongside 50 randomly drawn samples from the posterior, with the same color bar applying to all panels. Our measured JWST/MIRI and VISIR/NEAR astrometry is shown with the red hexagons and a blue diamond, respectively, and the predicted on-sky orbit position of the exoplanet between 1990 and 2040 is indicated with small gray points.
Other Images in This Article
Copyright and Terms & Conditions
© 2026. The Author(s). Published by the American Astronomical Society.