Image Details
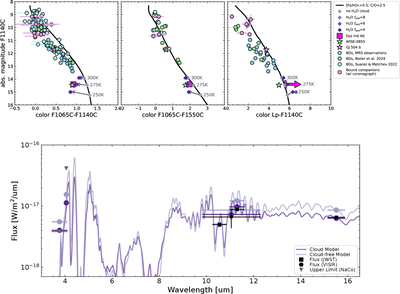
Caption: Figure 6.
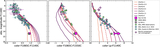
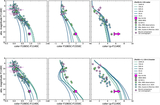
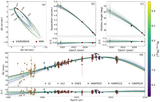
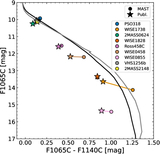
Upper panel: the CMD as in Figure 3 but with the impact of clouds highlighted. The black line shows the trend for the best-fit [Fe/H] and C/O from our small grid (see the text), while the purple diamonds show the impact of introducing increasingly thick water-ice clouds (parameterized via fsed), for models with temperatures 250 K, 275 K, and 300 K. The clouds have a more dramatic impact on the photometry at lower temperatures, where they reduce the relative depth of the ammonia feature, making the F1065C − F1140C and F1065C − F1550C colors redder, and subdue the near-IR emission, making the Lp-F1140C color redder. Lower panel: model emission spectrum for an atmosphere with thick water-ice clouds, generated with PICASO (N. E. Batalha et al. 2019; S. Mukherjee et al. 2023; J. Mang et al. 2026) and described in detail in the text. We also show a model without water-ice clouds but otherwise identical, for reference. The water-ice cloud model is a best fit from a small grid of models and is compatible with all in-hand photometry and upper limits for Eps Ind Ab.
Other Images in This Article
Copyright and Terms & Conditions
© 2026. The Author(s). Published by the American Astronomical Society.