Image Details
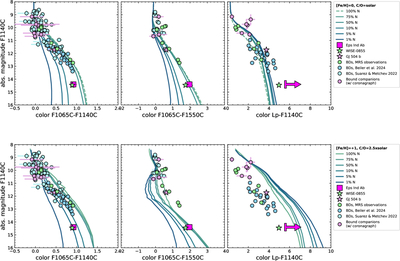
Caption: Figure 5.
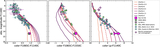
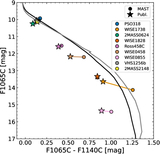
The same as Figure 3 but for models depleted in nitrogen. The top and bottom rows show, respectively, the case of solar metallicity and C/O and the case of enhanced metallicity and C/O, as found for Eps Ind Ab in E. C. Matthews et al. (2024). The percentage labels indicate the nitrogen content of each atmosphere as a fraction of the equilibrium models, and the model from Figure 3 is highlighted with a dashed line. Atmospheres strongly depleted (to 5%) in nitrogen are consistent with both the F1065C − F1140C color of Eps Ind Ab and WISE 0855, and strongly N-depleted atmospheres also have bluer L’ − F1065C colors. However, only in models with both (1) depleted nitrogen and (2) enhanced metallicity and C/O is the L’ − F1065C color sufficiently blue to match the observational constraints for Eps Ind Ab.
Other Images in This Article
Copyright and Terms & Conditions
© 2026. The Author(s). Published by the American Astronomical Society.