Image Details
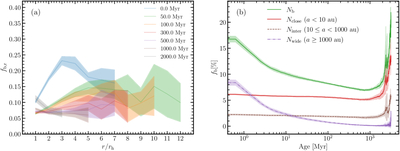
Caption: Figure 4.
Radial binary fraction of simulations (fb,r, a) of the models with N15k_10hb_40sb from Table 1. Lines represent the mean value of different randomizations, and the shaded region represents the standard deviation. Colors represent ages from 0.0 to 2000 Myr. Panel (b) shows the binary fraction of all (green), close (red), intermediate (brown), and wide (purple) binaries as a function of time for the same simulation set.
Other Images in This Article
Copyright and Terms & Conditions
© 2026. The Author(s). Published by the American Astronomical Society.
Copyright ©
2026 Astronomy Image Explorer. All Rights Reserved.