Image Details
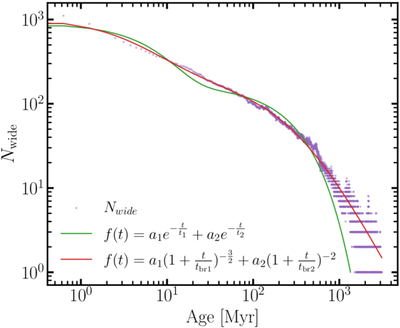
Caption: Figure 3.
Wide binary evolution models and the evolution of the number of wide binaries Nwide (purple) in one model from the set N15k_10hb_40sb (Table 1). The green curve is the exponential model (Equation (1)), and the red curve is the broken power-law model (Equation (2)).
Other Images in This Article
Copyright and Terms & Conditions
© 2026. The Author(s). Published by the American Astronomical Society.
Copyright ©
2026 Astronomy Image Explorer. All Rights Reserved.