Image Details
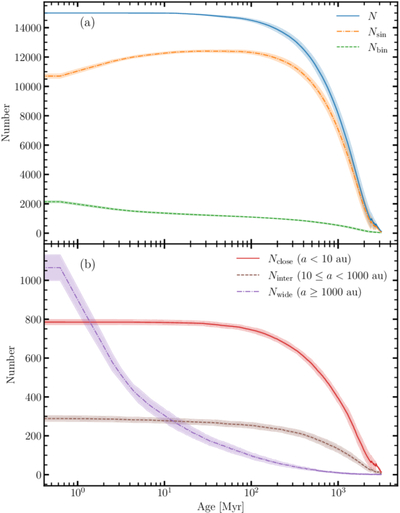
Caption: Figure 1.
(a) Evolution of total number of stars (blue), single stars (orange), and binaries (green) of the simulation set N15k_10hb_40sb from Table 1. (b) Number of close, intermediate (brown), and wide (purple) binaries for the same simulation set. Solid curves and shaded regions represent the mean and standard deviation values among randomized models in the set.
Other Images in This Article
Copyright and Terms & Conditions
© 2026. The Author(s). Published by the American Astronomical Society.
Copyright ©
2026 Astronomy Image Explorer. All Rights Reserved.