Image Details
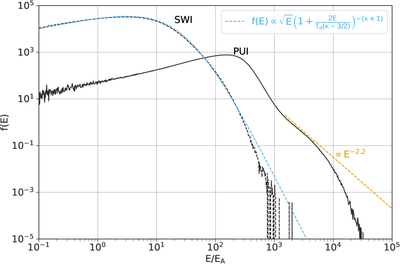
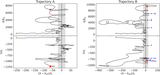
Caption: Figure 5.
Energy spectra of the SWI (black dashed line) and PUI (black solid line) components integrated into the downstream region (X − Xsh = 0 to 1000λi) at ΩciT = 500. The energy is normalized by ﹩{E}_{A}=0.5{m}_{i}{v}_{A}^{2}﹩. The orange dashed line corresponds to a power-law distribution with a power-law index of −2.2. The blue dashed line is a kappa distribution. The kappa index κ is 4.5, and the downstream ion temperature Td is ﹩5.25{m}_{i}{v}_{A}^{2}﹩.
Other Images in This Article
Copyright and Terms & Conditions
© 2026. The Author(s). Published by the American Astronomical Society.
Copyright ©
2026 Astronomy Image Explorer. All Rights Reserved.