Image Details
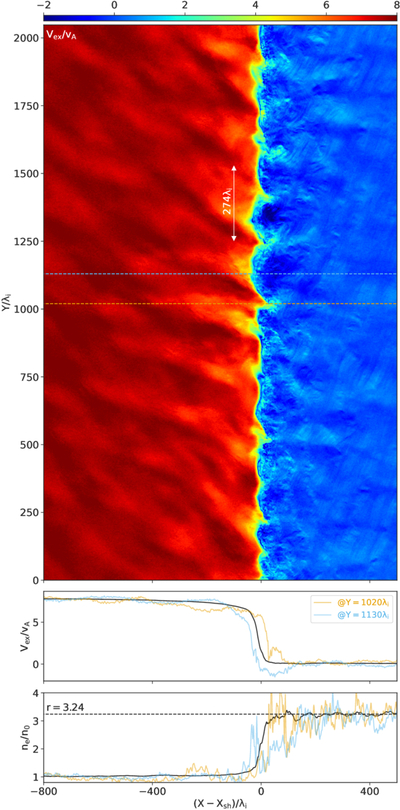
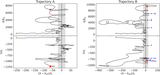
Caption: Figure 4.
Top panel: a snapshot of the electron fluid velocity, Vex, at ΩciT = 500. Middle panel: 1D profiles of Vex, spatially averaged over the y-direction (black line) and sliced at Y/λi = 1020 and 1130 (orange and blue lines), respectively. Bottom panel: 1D profiles of the electron density, spatially averaged over the y-direction (black line) and sliced at Y/λi = 1020 and 1130 (orange and blue lines), respectively. The black dashed horizontal line corresponds to the shock compression ratio, r = 3.24.
Other Images in This Article
Copyright and Terms & Conditions
© 2026. The Author(s). Published by the American Astronomical Society.
Copyright ©
2026 Astronomy Image Explorer. All Rights Reserved.