Image Details
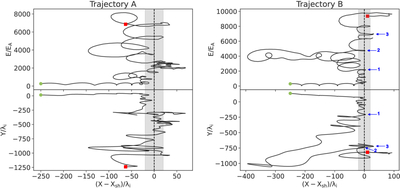
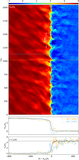
Caption: Figure 6.
The trajectory of two typically accelerated PUIs. The top and bottom panels correspond to the particle energy and the particle Y-position, respectively. The particle X-position is shifted in time so that the shock front is always at X = Xsh (black dashed line). The gray-shaded area represents the typical maximum and minimum extent of the shock rippling. Green and red points correspond to the start and end locations, respectively, and the time duration between them is ﹩100{{\rm{\Omega }}}_{ci}^{-1}﹩. Blue arrows indicate specular reflection.
Other Images in This Article
Copyright and Terms & Conditions
© 2026. The Author(s). Published by the American Astronomical Society.
Copyright ©
2026 Astronomy Image Explorer. All Rights Reserved.