Image Details
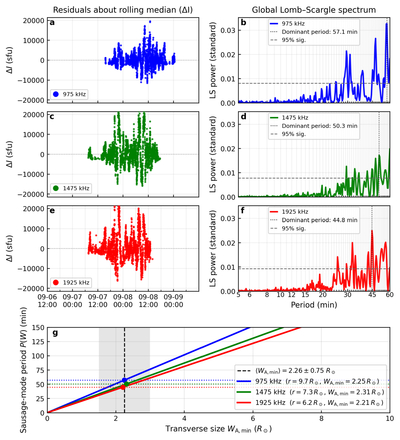
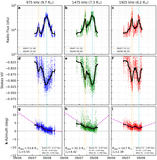
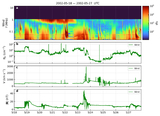
Caption: Figure 7.
Quasiperiodic pulsations and magnetoseismology during the high-confidence portion of Window 3 selected by I > 5 × 10³ sfu and V/I < −0.8 (Section 2.3). (a), (c), (e) Stokes I residuals ﹩{I}_{{\rm{res}}}(t)﹩ after subtracting a 256 minutes running-median trend; the red curve is a smoothed envelope highlighting the oscillations. (b), (d), (f) Lomb–Scargle periodograms of ﹩{I}_{{\rm{res}}}(t)﹩ computed from the residual time series shown in panels (a), (c), (e) show dominant periods P of 57.1, 50.3, and 44.8 minutes at 975, 1475, and 1925 kHz (vertical dashed lines). Dashed horizontal lines indicate the 95% false-alarm level. Periodograms are evaluated over periods of 5–60 minutes (the plotted range). (g) Panel (g) explicitly shows how the measured period P maps, through the adopted vA(r) model, to the lower bound ﹩{W}_{{\rm{A}},{\rm{\min }}}﹩ and hence to the minimum half-width ﹩{a}_{{\rm{\min }}}\equiv {W}_{{\rm{A}},{\rm{\min }}}/2﹩.
Other Images in This Article
Copyright and Terms & Conditions
© 2026. The Author(s). Published by the American Astronomical Society.