Image Details
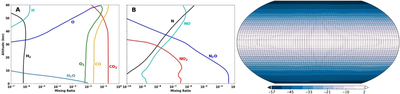
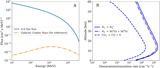
Caption: Figure 5.
Panels (A) and (B): production rates of C and N-bearing molecules, including N2O. Right panel: the ROCKE-3D model GMST map due to the impact of 100 ppmv of N2O in the 99%N21%CO2 atmospheric composition of the early Earth or a rocky exoplanet receiving 75% of the current solar luminosity.
Other Images in This Article
Copyright and Terms & Conditions
© 2026. The Author(s). Published by the American Astronomical Society.
Copyright ©
2026 Astronomy Image Explorer. All Rights Reserved.