Image Details
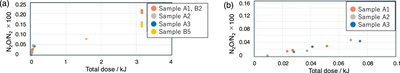
Caption: Figure 2.
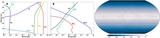
Panel (a): N2O/N2 ratios in gas mixtures of Sample A1–A3 and B5 for various doses of proton irradiation. Panel (b) is a zoomed-in version of panel (a), representing the doses between 0 and 0.1 kJ.
Other Images in This Article
Copyright and Terms & Conditions
© 2026. The Author(s). Published by the American Astronomical Society.
Copyright ©
2026 Astronomy Image Explorer. All Rights Reserved.