Image Details
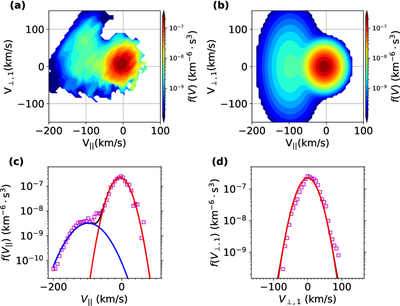
Caption: Figure 6.
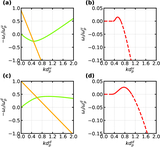
Panel (a) shows the upstream ion VDFs at 14:14:06 UT for the shock in Figure 5, displayed in MFA coordinates and shifted to the velocity of maximum phase-space density, with slices in the v∥−v⊥1 planes. Panel (b) shows the corresponding fitted VDFs using a two-component drift-bi-Maxwellian model. The bottom panels compare one-dimensional cuts of the observed VDFs (squares) with the fitted core (red), beam (blue), and total (black) components.
Other Images in This Article
Copyright and Terms & Conditions
© 2026. The Author(s). Published by the American Astronomical Society.
Copyright ©
2026 Astronomy Image Explorer. All Rights Reserved.