Image Details
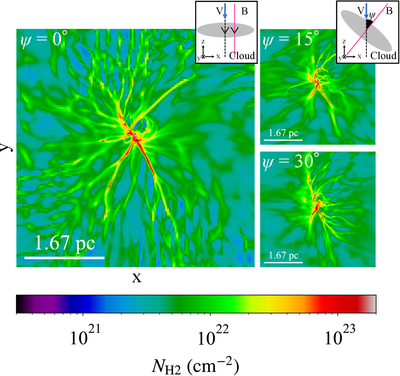
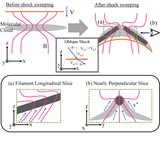
Caption: Figure 1.
H2 column density maps in the x–y plane at t = 0.5 Myr after the shock sweeps the cloud for different inclination angles ψ between the shock propagation direction and the magnetic-field axis. The panels show ψ = 0°, 15°, and 30°. The color scale represents the H2 column density integrated along the z-axis. The box size is 5.0 pc on each side. Small inset schematics in each panel illustrate the definition of the inclination angle ψ (between the shock propagation direction and the magnetic-field axis) and the corresponding initial cloud-field geometry; the gray shape, magenta line, and blue arrow indicate the initial cloud density profile, magnetic-field direction, and shock propagation direction, respectively.
Other Images in This Article
Copyright and Terms & Conditions
© 2026. The Author(s). Published by the American Astronomical Society.