Image Details
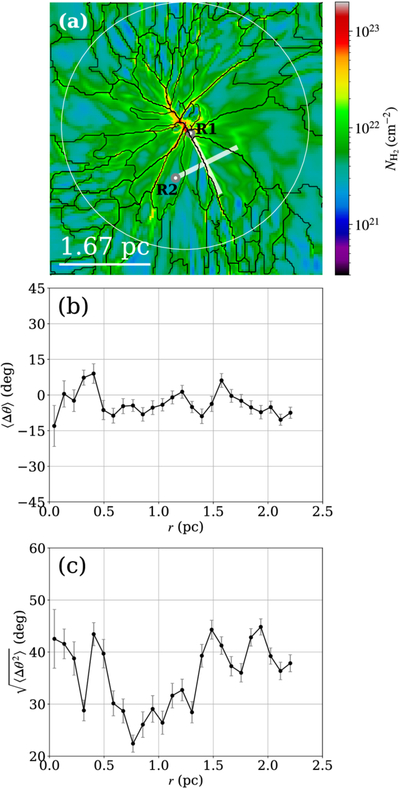
Caption: Figure 2.
(a) H2 column density map from the left panel of Figure 1, overlaid with filament skeletons identified using DisPerSE (T. Sousbie 2011; T. Sousbie et al. 2011). The lines labeled R1 and R2 denote cuts parallel and perpendicular to the filaments, respectively (see Figure 4 for details). The white circle (diameter of 4.5 pc) indicates the region centered on the density peak. (b)–(c) Radial profiles of the mean angle 〈Δθ〉 (b) and the rms angle (c) of the filaments relative to the radial vector from the hub center. The hub center is defined as the column density peak, distinct from the geometric center of the simulation box. The angle Δθ ranges from −90° to 90°, where 0° corresponds to the radial direction. The plots cover the region within the white circle in (a). Error bars represent the standard errors.
Other Images in This Article
Copyright and Terms & Conditions
© 2026. The Author(s). Published by the American Astronomical Society.