Image Details
Caption: Figure 3.
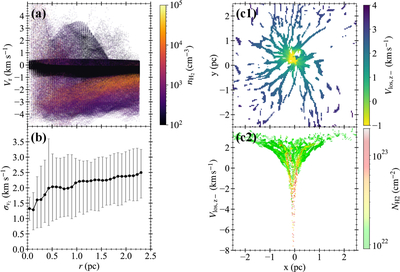
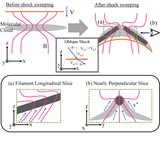
Velocity structure of the HFS 0.5 Myr after the shock impact. (a) Radial velocity Vr plotted as a function of the cylindrical radius r from the hub center. Vr and r are defined in a cylindrical coordinate system aligned with the z-axis. The color of each point corresponds to the H2 number density. Only cells within a cylindrical radius of r = 2.25 pc are plotted. (b) Median of the density-weighted velocity dispersion ﹩{\sigma }_{{v}_{z}}﹩ along the z-axis as a function of r. Error bars indicate the 95% confidence intervals. Note that in both panels, the hub center is defined as the position of the peak gas density at this epoch and does not coincide with the origin of the computational domain. (c1 and c2) Observationally motivated kinematic maps constructed from the same snapshot as in the left panel of Figure 1. (c1) Column-density-selected line-of-sight velocity map. Only regions with ﹩{N}_{{{\rm{H}}}_{2}}\gt 8\times 1{0}^{21}\,{{\rm{cm}}}^{-2}﹩, corresponding approximately to the mean column density of the identified filaments, are included. The line-of-sight velocity components are measured along the z-axis from an observer located at z = −∞ and are shown in the laboratory frame. (c2) Position–velocity (PV) diagram showing the line-of-sight velocity Vlos,z− as a function of the projected x-coordinate, weighted by the column density.
Other Images in This Article
Copyright and Terms & Conditions
© 2026. The Author(s). Published by the American Astronomical Society.