Image Details
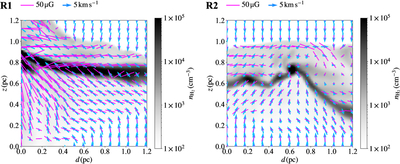
Caption: Figure 4.
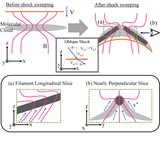
Distributions of density, velocity, and magnetic fields in slices along the filament axis (R1) and across the filament width (R2). The positions of these cuts are indicated by white lines in Figure 2(a). Magenta bars and blue arrows denote the magnetic field and velocity vectors, respectively. The velocity vectors are presented in the shock rest frame (vshock = −5 km s−1). The grayscale represents the H2 number density. The horizontal axis d corresponds to the distance along the cut, where the white circle with a gray outline in Figure 2(a) marks the starting points (d = 0). The vertical axis z represents the vertical position within the slice.
Other Images in This Article
Copyright and Terms & Conditions
© 2026. The Author(s). Published by the American Astronomical Society.