Image Details
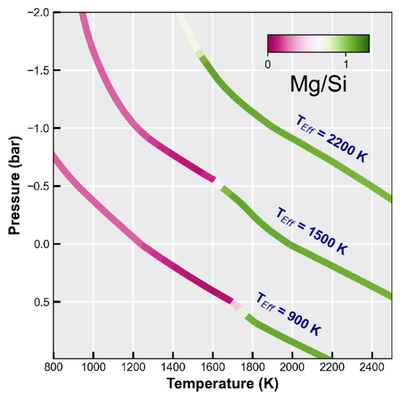
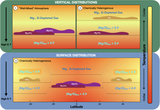
Caption: Figure 6.
This figure details how the gaseous Mg/Si ratio changes as a function of the pressure and temperature under thermochemical equilibrium in substellar mass atmospheres. Three P–T curves are shown for Teff = 2200, 1500, 900 K from C. V. Morley et al. (2024), uniformly chosen at solar metallicity and C/O and fsed = 4, log(g) = 4.0. Green P–T points indicate a gaseous bulk Mg/Si = 1.05, whereas pink P–T points indicate regions where refractory material has condensed out, driving gaseous Mg/Si to zero.
Other Images in This Article
Copyright and Terms & Conditions
© 2026. The Author(s). Published by the American Astronomical Society.
Copyright ©
2026 Astronomy Image Explorer. All Rights Reserved.