Image Details

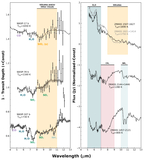
Caption: Figure 1.
The top figure shows the planetary-to-protosolar elemental abundance ratio for major volatile elements (C, N, O) in Jupiter, Saturn, Uranus, and Neptune, adapted from S. K. Atreya et al. (2020). Protosolar values are based on the solar photospheric values from M. Asplund et al. (2009). Measurements of carbon and nitrogen in the giant planets come from a combination of ground and space-based observations, as detailed in S. K. Atreya et al. (2020), and should be treated with caution due to large uncertainties that make the likelihood of these values being upper or lower limits nonzero. The oxygen measurements for Jupiter come from the Juno MWR (diamond; C. Li et al. 2020) and the GPMS (upper limit; H. B. Niemann et al. 1996). The bottom figure shows various element ratios in carbonaceous chondrite groups from K. Lodders (2021). Dashed lines represent the respective solar elemental abundance ratio.
Other Images in This Article
Copyright and Terms & Conditions
© 2026. The Author(s). Published by the American Astronomical Society.