Image Details
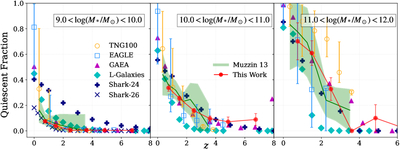
Caption: Figure 4.
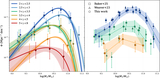
The redshift evolution of the QG fraction in different stellar mass bins. Predictions from EAGLE, TNG, GAEA, L-Galaxies, and Shark, along with observational data from A. Muzzin et al. (2013), are plotted for comparison. We include the ﹩9\lt {\mathrm{log}}{M}_{\star }/{M}_{\odot }\lt 9.5﹩ bin to match the mass range of A. Muzzin et al. (2013), noting that completeness issues have a reduced impact on the fraction compared to number density. Model QGs are selected using sSFR < 0.2/tHubble(z). While discrepancies exist, the best-performing theoretical models reasonably reproduce the QG fraction evolution up to z = 8.
Other Images in This Article
Copyright and Terms & Conditions
© 2026. The Author(s). Published by the American Astronomical Society.