Image Details
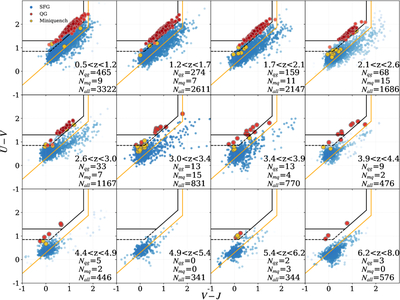
Caption: Figure 1.
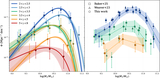
The UVJ color–color diagram for the photometric sample with M⋆ > 109.0 M⊙. The comoving volume is nearly constant across all redshift slices (except for the highest-redshift bin), allowing for a direct comparison of the number density evolution of QGs and SFGs. The orange line denotes our inclusive preselection boundary (defined in Equations (1) and (2)). The solid black line indicates the standard UVJ criterion proposed by R. J. Williams et al. (2009), while the dashed black line shows an extended criterion (lowering the U − V threshold to 0.85). This extended cut is designed to include high-redshift PSBs, though it introduces substantial contamination from SFGs. This diagram does not include contamination removed in Section 3.2.
Other Images in This Article
Copyright and Terms & Conditions
© 2026. The Author(s). Published by the American Astronomical Society.