Image Details
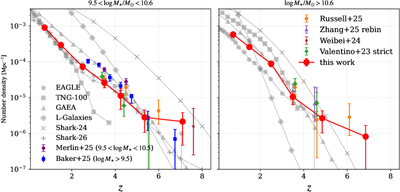
Caption: Figure 3.
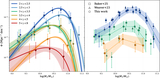
The mass-dependent number density evolution of QGs. Error bars represent the combined effects of Poisson noise and cosmic variance; for low-redshift data points, the relative errors are approximately 10% and thus not visible. Observational results from F. Valentino et al. (2023), W. M. Baker et al. (2025b), E. Merlin et al. (2025), T. A. Russell et al. (2025), and Y. Zhang et al. (2026) are included for comparison. To ensure consistency, data from Y. Zhang et al. (2026) have been recalculated for the mass range ﹩{\mathrm{log}}{M}_{\star }/{M}_{\odot }\gt 10.6﹩. Unless otherwise noted, all comparison works report number densities within the same mass range indicated in the panel titles. Small redshift offsets (Δz = 0.1) are applied to some data points to minimize overlap. We compare our results with predictions from EAGLE, TNG, GAEA, L-Galaxies, and Shark, adopting a uniform selection threshold of sSFR < 0.2/tHubble(z) for the models.
Other Images in This Article
Copyright and Terms & Conditions
© 2026. The Author(s). Published by the American Astronomical Society.