Image Details
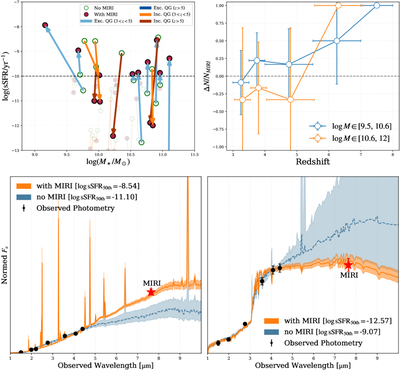
Caption: Figure 2.
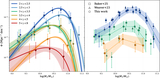
Impact of MIRI photometry on QG selection. Top left: migration of galaxies in the sSFR–M⋆ plane upon the inclusion of MIRI photometry. Orange arrows highlight sources reclassified from SFG to QG, while blue arrows indicate the reverse (QG → SFG). Sources with unchanged classifications are shown with reduced opacity. Top right: the relative change in QG number density as a function of redshift across different stellar mass bins. Error bars represent Poisson uncertainties. Bottom panels: two illustrative examples where MIRI photometry is decisive for correct classification. Bottom left: a dusty SFG where the addition of MIRI data resolves SED degeneracies, leading to a correct fit. Bottom right: a QG at z = 7.2 (spectroscopically confirmed by A. Weibel et al. 2025) that was misidentified as star-forming without MIRI constraints, demonstrating the critical role of MIRI coverage in identifying high-redshift QGs.
Other Images in This Article
Copyright and Terms & Conditions
© 2026. The Author(s). Published by the American Astronomical Society.