Image Details
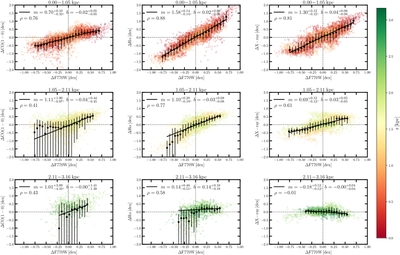
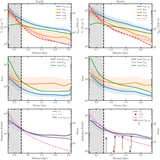
Caption: Figure A1.
Residual plots showing gas phase intensity (y-axis) and F770W intensity (x-axis) corrected for distance. From left to right, the columns are for CO(1–0), Hα, and X-ray. From top to bottom, the rows are distance separations at 0–1.05 kpc, 1.05–2.11 kpc, and 2.11–3.16 kpc. The upper distance bound is the maximum distance from all datasets. The black points are the medians for the distribution of data points, and the error bars are the 16th and 84th percentiles. In the top left of each panel, we show the best power-law fits to the medians and Spearman's rank correlation coefficient of the whole distribution.
Other Images in This Article

Copyright and Terms & Conditions
© 2026. The Author(s). Published by the American Astronomical Society.