Image Details
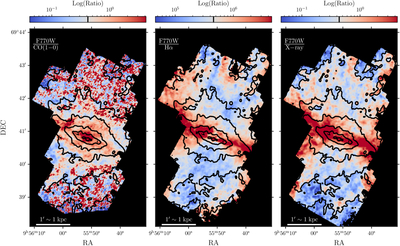
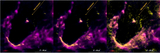
Caption: Figure 4.
Ratio maps of JWST F770W to other wavelengths. All images were convolved to 2﹩\mathop{.}\limits^{^{\prime\prime} }﹩2 and reprojected onto the same grid, and the ratio is shown on a log stretch centered on the median value (light blue), and the color bar bounds are one dex below and above the median. Black contours mark the JWST F770W intensity. Within the central starburst, PAH emission appears enhanced relative to all other tracers. For the PAH-to-CO (MJy sr−1 /K km s−1), the red patches are where the CO emission is negative; thus, they are set to upper limits. Elsewhere, the CO and PAHs show a fairly constant ratio (light blue). Both PAH-to-Hα (MJy sr−1/erg cm−2 s−1 sr−1) and PAH-to-X-ray (MJy sr−1/Counts) ratios appear enhanced in the galaxy disk (due to extinction) and along the image edges (red), with patchy ratios (white and salmon) visible in the interior. This appears consistent with a picture where the PAH emission arises from cool material surrounding the hot wind, or patchy, filamentary cool material is mixed into the wind.
Other Images in This Article
Copyright and Terms & Conditions
© 2026. The Author(s). Published by the American Astronomical Society.