Image Details
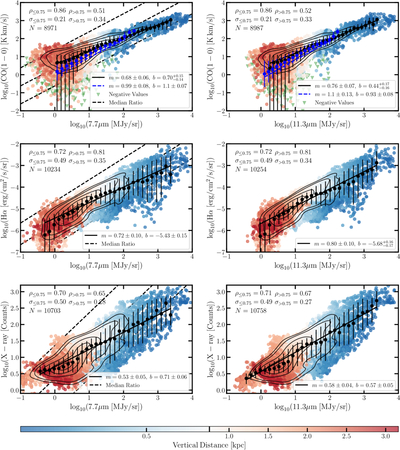
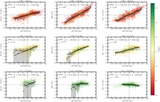
Caption: Figure 3.
Correlations between PAH emission and gas tracers at ∼38 pc resolution. The left column shows the relationship between JWST F770W and gas tracers, and the right shows the same for F1130W. The color of points indicates their vertical distance from the M82 center. Overplotted are the median ratios of the bands along with the maximum and minimum of the color bar in Figure 4. The top row shows the relation between PAH and CO(1–0) emission, the middle row compares to Hα, and the bottom row to X-ray emission. Black points in each panel show median y values after binning the data by x, with error bars showing the 16%–84% range in each bin. The best-fit power law describing the bins is shown by the solid black line. Black contours enclose 15%, 25%, 50%, 75%, and 95% of the data points, and green triangles in the top panels show the absolute value of CO data where the background-subtracted intensity is negative due to noise fluctuations. Dark blue points and dashed lines in the top row show the PAH–CO(2–1) relationships found for 70 galaxy disks by R. Chown et al. (2025). In each panel, we report Spearman rank coefficients (ρ), number of points in the correlation (N), and scatter (σ) of the data (in dex) about the best fit at distances above and below 750 pc (marked by the black line in the center of the color bar). All gas tracers show good agreement with PAH emission, and the CO–PAH relationship closely resembles that found in galaxy disks.
Other Images in This Article

Copyright and Terms & Conditions
© 2026. The Author(s). Published by the American Astronomical Society.