Image Details
Caption: Figure 2.
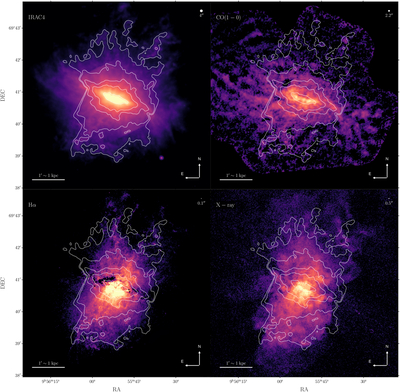
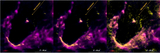
Log-stretch images of M82’s multiphase outflow. Top Left: Spitzer 8 μm image from C. W. Engelbracht et al. (2006) reflecting mostly PAH 7.7 μm emission. Top Right: IRAM NOEMA+30 m CO(1–0) emission from N. Krieger et al. (2021) tracing cold molecular gas. Bottom Left: HST Hα map tracing ∼104 K ionized gas from S. Lopez et al. (2025). Bottom Right: Chandra X-ray emission from L. A. Lopez et al. (2020) tracing hot ∼107 K gas. The contours in all panels show the JWST 7.7 μm intensity (50, 75, 90, 95, 99 percentiles) as well as the field of view of the JWST data. The PSF size for each of the images is shown in the top right.
Other Images in This Article

Copyright and Terms & Conditions
© 2026. The Author(s). Published by the American Astronomical Society.