Image Details

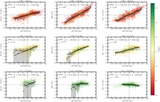
Caption: Figure 5.
Profiles as a function of distance from the disk toward the north (left) and south (right). These profiles were constructed at a resolution of 27″ (≈500 pc) to match the lowest resolution datasets. The profiles span the area covered by the JWST mapping (3﹩\mathop{.}\limits^{^{\prime} }﹩2 × 2﹩\mathop{.}\limits^{^{\prime} }﹩2 in the north and 2﹩\mathop{.}\limits^{^{\prime} }﹩4 × 2﹩\mathop{.}\limits^{^{\prime} }﹩0 in the south). We calculate the total gas surface density of the neutral phase as ﹩{{\rm{\Sigma }}}_{\mathrm{HI}+{{\rm{H}}}_{2}}={{\rm{\Sigma }}}_{\mathrm{HI}}+{I}_{\mathrm{CO}(2-1)}{\alpha }_{\mathrm{CO}}^{(2-1)}﹩ assuming ﹩{\alpha }_{{\rm{CO}}}^{(2-1)}=1\,{M}_{\odot }\,{{\rm{pc}}}^{-2}{({\rm{K}}\,{\rm{km}}\,{{\rm{s}}}^{-1})}^{-1}﹩ and an R21 = 0.6 we derived from the IRAM CO(2–1) and CO(1–0) maps from A. K. Leroy et al. (2015). For reference, we add a vertical line at 750 pc since below that distance the H I goes into absorption and becomes unreliable. The top row shows the mass surface densities of the H I, H2, and the total neutral gas. Also shown is the fall off in intensity for the 8 μm PAH emission from Spitzer. The shaded areas around the H2 and total gas mass are to mark the uncertainty in the αCO used (0.5 < αCO < 2). The middle row shows ratios that trace the coupling between PAH emission and the cold gas phases: 8 μm/H2, 8 μm/H I, and 8 μm/MHI + H2. The bottom row shows different radiation field estimates: an analytic 1/r2 decline (dashed pink), 〈U〉 from dust SED modeling (solid violet), and G/G0 from [C II] PDR modeling (brown squares). The radiation field and PAH/MHI+H2 ratio behave similarly, showing how the radiation field affects the PAH intensity.
Other Images in This Article

Copyright and Terms & Conditions
© 2026. The Author(s). Published by the American Astronomical Society.