Image Details
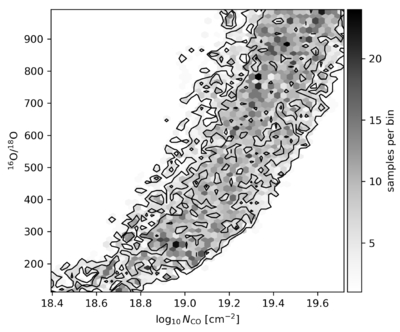
Caption: Figure 8.
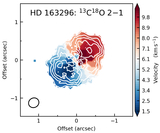
Two-dimensional posterior distribution of 16O/18O versus ﹩\mathrm{log}{N}_{{\rm{CO}}}﹩ from the MCMC analysis. The color scale indicates the number of samples per bin; overplotted contours mark the 68% and 95% credible regions. The elongated ridge illustrates the strong positive covariance between 16O/18O and NCO: larger oxygen isotope ratios can be compensated by higher CO columns while preserving the C18O(1–0) flux.
Other Images in This Article
Copyright and Terms & Conditions
© 2026. The Author(s). Published by the American Astronomical Society.
Copyright ©
2026 Astronomy Image Explorer. All Rights Reserved.