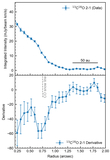
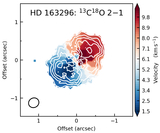
Image Details
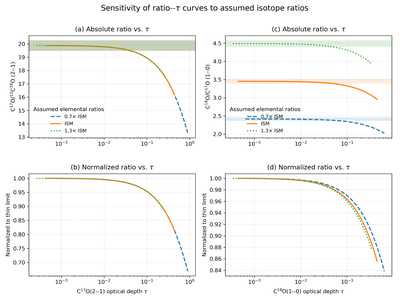
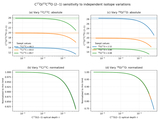
Caption: Figure 6.
Test B: sensitivity of the ratio-τ relation to coherent scaling of all isotopic ratios by ±30% around the ISM values. Top panels: absolute C17O/13C18O(2–1) (left) and C18O/C17O(1–0) (right) ratios as a function of line-center optical depth. Bottom panels: normalized curves collapse to within ≲1%–2% for τ ≲ 0.3, confirming the robustness of our optical depth diagnostic and thin-region identification.
Other Images in This Article
Copyright and Terms & Conditions
© 2026. The Author(s). Published by the American Astronomical Society.
Copyright ©
2026 Astronomy Image Explorer. All Rights Reserved.