Image Details
Caption: Figure 2.
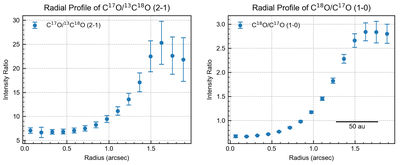
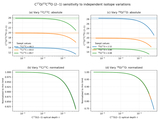
Radial profiles of the same-transition isotopologue intensity ratios. Left: C17O/13C18O(2–1) ratio, flat at small radii, rising steeply across the CO snowline, and converging to ∼20 beyond 1﹩\mathop{.}\limits^{^{\prime\prime} }﹩5. Uncertainties include both statistical errors and a 7.1% systematic calibration term, as the two lines were observed in different bands and epochs. Right: C18O/C17O(1–0) ratio, showing similar radial behavior and approaching ∼2.7 beyond 1﹩\mathop{.}\limits^{^{\prime\prime} }﹩5. Only statistical uncertainties are shown, since both lines were observed in the same band and share a common amplitude calibration. In both panels, the rapid increase followed by a flat plateau indicates the sharp decline in CO column density across the snowline and identifies the outer disk as an optically thin region suitable for isotopic ratio analysis.
Other Images in This Article
Copyright and Terms & Conditions
© 2026. The Author(s). Published by the American Astronomical Society.