Image Details
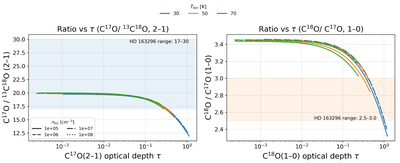
Caption: Figure 3.
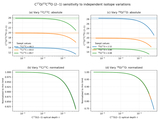
RADEX-calculated same-transition isotopologue flux ratios as a function of line-center optical depth for a range of ﹩{n}_{{{\rm{H}}}_{2}}﹩ and Tkin. Upper: C17O/13C18O(2–1) ratio versus C17O(2–1) optical depth. Lower: C18O/C17O(1–0) ratio versus C18O(1–0) optical depth. In the optically thin regime (τ ≪ 1), the ratios converge to the values set by ISM isotopic abundances (19.2 and 3.6, respectively), and decline rapidly once the more abundant line becomes optically thick (τ ≳ 1). The shaded regions indicate the plateau ranges of the ratios measured in HD 163296 beyond 1﹩\mathop{.}\limits^{^{\prime\prime} }﹩5 (see Figure 2), where all transitions are optically thin. This comparison shows that the observed plateau values fall squarely in the optically thin regime, confirming their suitability for constraining isotopic ratios.
Other Images in This Article
Copyright and Terms & Conditions
© 2026. The Author(s). Published by the American Astronomical Society.