Image Details
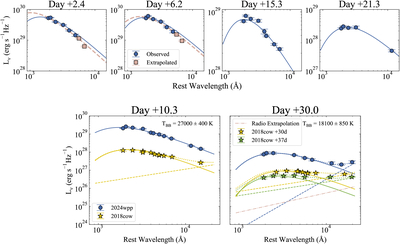
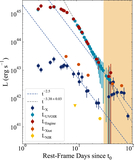
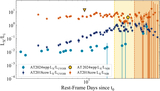
Caption: Figure 12.
Top panel: blackbody fits to the observed photometry (blue points) at various epochs (observed-frame days). Pink points are extrapolated r- and i-band photometries that assume the w1–r and w1–i colors shown in Figure 13. Bottom panel: AT 2024wpp SEDs on the (observed-frame) days of its J- and H-band photometry compared to coeval SEDs of AT 2018cow. We find no evidence of emission in excess of a blackbody fit (blue curves) until day +30, at which time a blackbody plus power-law model (blue dashed curve) is required to fit the SED. The best-fit power law (blue dashed line; Fν ∝ ν−α) has α = 2.7 ± 0.5. AT 2024wpp is not fit well by the power law (α = 0.75; yellow and green dashed lines) that D. A. Perley et al. (2019) and Y. Chen et al. (2023a) used to fit the NIR excess of AT 2018cow. Additionally, the extrapolation of the coeval radio SED (pink curve; from Paper II) cannot explain the observed NIR excess.
Other Images in This Article
Show More
Copyright and Terms & Conditions
© 2026. The Author(s). Published by the American Astronomical Society.