Image Details
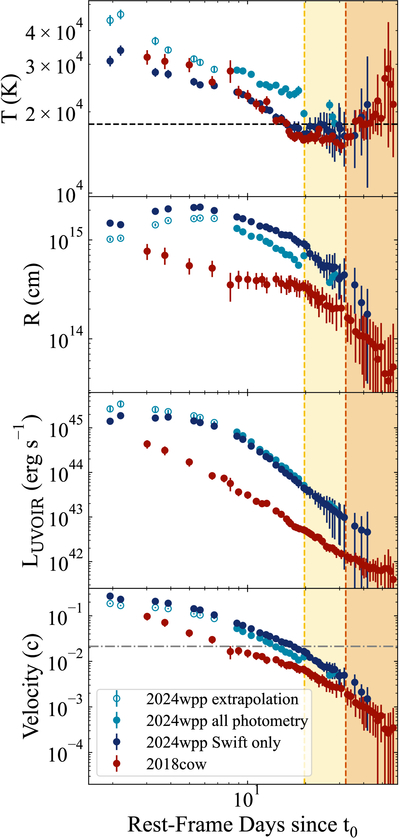
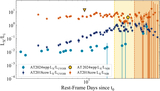
Caption: Figure 5.
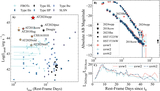
Temporal evolution of the best-fitting blackbody temperature T, radius R, bolometric luminosity LUVOIR, and blackbody expansion velocity of AT 2024wpp (shades of blue) compared to AT 2018cow (red) from R. Margutti et al. (2019). Dark (light) blue filled points: results from the Swift (Swift+LCO+Gemini) photometry. Open circles assume the color extrapolation presented in Figure 13 for w1—r and w1—i between days +2 and +7 from t0. AT 2024wpp reaches T > 30,000 K (potentially as high as ≳40, 000 K), and similarly to AT 2018cow, the T plateaus at late times around T ≈ 20,000 K (horizontal dashed black line in the top panel). Yellow and orange shaded areas indicate the time of emergence of spectroscopic features in AT 2018cow and AT 2024wpp, respectively. The horizontal gray dashed–dotted line marks a velocity of ∼6400 km s−1, which corresponds to the observed blueshift velocity of spectroscopic features that emerge between +16 and +30 days (see Figure 2).
Other Images in This Article
Show More
Copyright and Terms & Conditions
© 2026. The Author(s). Published by the American Astronomical Society.