Image Details
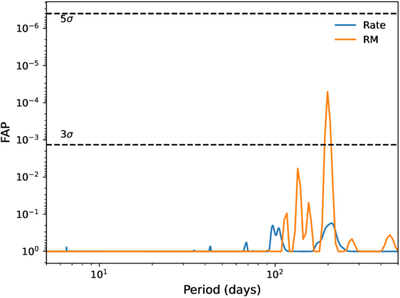
Caption: Figure 5.
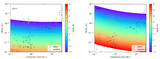
FAP versus trial period in the LSP. Orange points show FAP values for each trial period in the RM periodicity search, while blue points denote results from the burst rate periodicity analysis. Gray dashed lines indicate statistical significance thresholds corresponding to 3σ and 5σ confidence levels. The y-axis is inverted, with FAP values decreasing from bottom to top.
Other Images in This Article
Copyright and Terms & Conditions
© 2025. The Author(s). Published by the American Astronomical Society.
Copyright ©
2025 Astronomy Image Explorer. All Rights Reserved.