Image Details
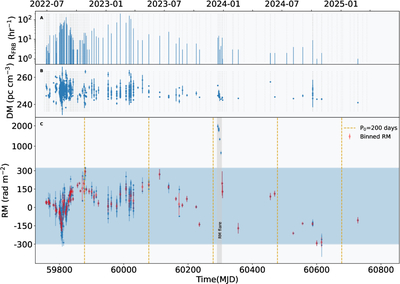
Caption: Figure 1.
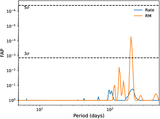
Temporal evolution of RM, DM, and burst rate in FRB 20220529. (A) FRB daily burst rate. Grey vertical dashed lines indicate observation days (bursts detected and undetected). The y-axis of the plot is logarithmic. (B) DM of bursts. The blue points represent the detected DM values with their uncertainties. (C) RM of bursts. The filled blue region delineates the RM variation range excluding the RM flare epoch, with the y-axis range scaled to compress the RM flare region and enhance the visibility of the primary dataset. The red points correspond to the daily-binned RM values. The orange lines mark the phases corresponding to the peak of the 200 day period, approximately at phase 0.25.
Other Images in This Article
Copyright and Terms & Conditions
© 2025. The Author(s). Published by the American Astronomical Society.