Image Details
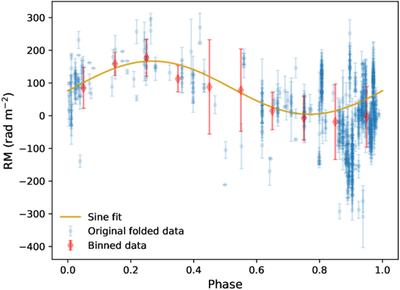
Caption: Figure 3.
Phase-folded RM variations with a 200 day period. The blue points represent the observed RM values and their uncertainties. The red points show the averaged RM values within each phase bin. The orange line depicts the fit result to a sine function.
Other Images in This Article
Copyright and Terms & Conditions
© 2025. The Author(s). Published by the American Astronomical Society.
Copyright ©
2025 Astronomy Image Explorer. All Rights Reserved.